Relationship between Scientific Method and Experimental Method
The Scientific Method is a systematic approach aimed at understanding the universe based on observation and logic. This approach generates knowledge through verified and tested empirical evidence.
The Experimental Method is an integral component of the scientific method that involves the collection of empirical data through direct testing. It is one of various methods used in the scientific process to validate hypotheses and generate new knowledge. Through the experimental method, theories derived from the scientific method can be tested and strengthened or, if necessary, refuted and corrected. Thus, the experimental method plays a crucial role in the formation and refinement of scientific knowledge.
Terms in Experimental Design
- Experiment: A scientific procedure designed to test a hypothesis by manipulating and controlling certain variables under specified conditions. For example, in a biological experiment, researchers might want to test the hypothesis that lighting affects plant growth. They would set up several plants under different lighting conditions and measure their growth. In an agricultural context, this could refer to an experiment to test a hypothesis like "Fertilizer X will increase rice yield by 20%". Researchers would conduct the experiment under controlled conditions, for example using the same field, the same variety of rice, and the same climatic conditions, but with and without the use of fertilizer X.
- Design: The effort or intricacies involved in creating a plan. This could include determining which variables will be manipulated, what variables will be measured, and how the data will be collected and analyzed. For example, in designing an experiment on the effects of lighting on plant growth, researchers need to decide how many plants will be used, how long the experiment will run, and what method will be used to measure growth.
- Plan: The outcome of the design process, usually contains a detailed scheme of the experiment, including variables to be studied, data collection methods, experimental procedures, and measurement tools to be used.
- Trial: The process of conducting an experiment under restricted conditions to examine the results or effects of something. It is usually used in a periodic or discontinuous context.
- Testing: The process of examining and analyzing something to determine its quality or performance. Directed towards success, not to answer how that success occurred. For example, testing seed germination, where seeds are tested to see if they can grow well under certain conditions, without needing to understand the biological processes happening behind that growth.
- Experimentation: A scientific procedure involving testing a hypothesis by manipulating certain variables and measuring the results. Directed to understand the problem through the structure of a test that is analyzed as a whole. For example, in a fertilization experiment, researchers might set up a series of experiments to understand how different types and amounts of fertilizer affect plant growth. The analysis of these experiments will involve examining the overall data to understand how these variables interact and affect the outcome.
Things needed in conducting an experiment:
- Experiment Objectives: These should be formulated clearly and usually include the hypothesis or influence to be tested. For example, "To compare the effect of two types of fertilizers, A and B, on the growth rate of corn plants."
- Treatment: This refers to the variable that will be applied or manipulated in the experiment. The treatment must be detailed and carefully designed to ensure the validity of the results. For example, in an experiment involving fertilizers, the treatment could be the "type of fertilizer" (A or B).
- Method: This refers to the procedures used to conduct the experiment and data collection. The details of the procedure should be carefully arranged and thoroughly explained. For example, "Corn plants will be planted in similarly sized pots and given fertilizer A or B. The height of the plants will be measured every week for 12 weeks."
- Experimental and Observation Units: The experimental unit refers to the individual unit that the treatment is applied to, while the observation unit is the unit that measurements are taken from. For example, in a fertilizer experiment, each pot with a corn plant might be considered one experimental unit whereas what's measured or observed, say, the height of the corn plant grown in each pot is the observation unit.
- Measurement: The data that will be collected during the experiment should be determined in advance and data recording must be done carefully. You should determine what will be measured before conducting the experiment. In a fertilizer experiment, you might measure the height of the corn plants, the number of leaves, or the total weight of the plants at the end of the experiment.
- Experimental Design: This refers to the working scheme used in the experiment, detailing how the experiment will be conducted. This can include the number of experimental units, the number of repetitions, and how the treatment will be allocated to the experimental units, how the data will be collected and analyzed. For example, you might decide to have 10 pots for each type of fertilizer and rotate the location of the pots every week to control for environmental effects.
- Justification for Design and Repetitions: The number of repetitions in an experiment should be sufficient to obtain reliable results but not too many to be inefficient. For example, if you have limited resources, you might choose to have five repetitions of each treatment instead of ten.
- Randomization: This refers to the process of randomly assigning subjects or experimental units to treatment groups to avoid bias. For example, if you decide on the position of the pots randomly, then you reduce the likelihood that environmental effects (such as sunlight or temperature) will affect the results.
- Proposed Statistical Analysis: This refers to the method of analysis that will be used after the data is collected. This method should be predetermined to ensure that the data collected fits the analysis needs and should align with the objective of the experiment. For example, if you want to compare the effects of two types of fertilizers, you might choose to perform a t-test (difference between two means test) or ANOVA (analysis of variance) if there are more than two treatments.
Experimental Design
Experimental design is the process of planning an experiment with the goal of obtaining relevant and high-quality information that aligns with the research objectives. Proper design is crucial to maximize the efficiency and quality of collected data and to ensure that the conclusions drawn from the data are valid and reliable.
Why Design is Necessary
- Eliminate Bias: Well-designed experiments can help minimize or eliminate bias, including systematic errors that can compromise the validity of results.
- Improve Precision: By controlling factors that might influence outcomes, experimental design can enhance the precision of results and ensure that the observed effects come from the variable under study, not other factors.
- Generalize Results: Good experimental design allows researchers to generalize their findings to a larger target population. In other words, the results of the experiment can be applied to other situations and individuals beyond the ones studied.
Objectives of Experimental Design
- Select Influential Variables: The goal of experimental design is to select control variables (X) that most influence the response (Y). By understanding which variables have a major influence, researchers can focus on these variables in further research.
- Approach the Expected Value: Experimental design can assist researchers in selecting a set of control variables (X) that produces response values closest to the expected value.
- Reduce Response Variance: Experimental design can also assist in selecting a set of control variables that result in the smallest response variance (σ²), meaning more consistent results.
- Reduce the Influence of Uncontrolled Variables: In an ideal situation, researchers would be able to control all variables that might influence the outcome. However, this is often impossible. Therefore, good experimental design also involves the selection of a set of control variables that result in minimal influence from uncontrollable variables.
Steps in Research Activities (Experimental Procedures to Achieve Objectives)
- Selecting a Problem: This step requires sensitivity and a good understanding of the research field. You need to identify and understand the problem to be studied. For example, if you're trying to figure out why farmers' corn crops aren't maximizing yield, you need to determine whether this is due to soil infertility, improper farming methods, or improper fertilizer use.
- Preliminary Study: This step involves exploratory research to gather more information about the topic to be studied. You need to review related literature and previous research findings to inform your experiment.
- Formulating the Problem: You need to clearly and specifically formulate your research problem. This step involves identifying concepts or theories that can be used to solve the problem. For instance, you might formulate that applying manure fertilizer in the right dose can improve soil fertility.
- Formulating a Hypothesis: This step involves creating a hypothesis statement based on previous research findings and existing theories. This hypothesis will form the basis of your experiment.
- Selecting an Approach: You need to choose the research method to be used, as well as determine the type and kind of research most suitable for the identified problem. This selection will greatly determine your research's variables, objects, subjects, and data sources.
- Identifying Variables and Data Sources: You must determine your research variables and where the data will be obtained from. These variables should align with your research objectives and hypothesis.
- Determining and Arranging Instruments: You need to determine the type of data required and where it will be obtained from. You also need to select an appropriate data collection method, such as observation, interviews, or questionnaires.
- Collecting Data: This step involves data collection in accordance with the determined method.
- Data Analysis: The collected data need to be analyzed carefully and with a deep understanding of the data. The analysis technique used will be greatly determined by the type of data collected.
- Drawing Conclusions: By considering all the data and analysis results, you will draw conclusions from the research. You need to be honest in assessing whether your hypothesis has been proven or not.
- Compiling a Report: The final step involves writing and organizing the research report. The report must be written in correct and good language, and it should cover all aspects of the research, including methodology, findings, and conclusions.
Objectives & Goals of the Experiment
- Purpose of the Experiment: The purpose of an experiment is the fundamental reason why the experiment is being conducted. In a scientific context, the purpose of an experiment is typically focused on efforts to gain new knowledge or deepen understanding of a phenomenon. This purpose can also be referred to as an endeavor to achieve the goals of the experiment. For instance, the purpose of an experiment could be to understand how a certain object or system responds to various conditions or specific variables. In many experiments, these conditions or variables are deliberately created or introduced, for example through certain treatments or environmental settings.
- Goals of the Experiment: The goals of an experiment refer to the anticipated or targeted outcome of the experiment, which is typically a manifestation or accomplishment of the experiment's purpose. In other words, the goal is the result that one aims to achieve from the research or experiment. For example, if you are conducting an experiment to understand the adaptation of various soybean varieties in peatland, your experimental goal might be to find the most adaptive soybean variety in peatland.
So, in research or an experiment, the purpose is why you are doing it, while the goal is what you hope or aim to achieve as a result of the experiment.
Components/Classification of Experimental Design
In an experiment, the examination of responses to determined treatments and environmental conditions can face several obstacles. These obstacles include the natural variability inherent in each object and the influence of various external factors that cannot be arranged for all objects in the experiment. In this case, statistics can be a tool for researchers to separate and investigate sources of response variability, including parts caused by treatment, environment, and other influences that cannot be clearly identified.
There are three key components to consider in experimental design:
- Treatment Design: Specific conditions that are deliberately created to induce a response. Treatment can be interpreted as specific conditions given to experimental units. This relates to how the treatment is structured, such as through single factor, factorial, split plot, or split block. The treatments are generally designed in a crossed or nested structure.
- Treatments are designed in a crossed (crossed) structure or factorial pattern if each level of one treatment appears at each level of another treatment. For example: If Treatment A has 6 levels, and Treatment B has 3 levels, then the cross-treatment design is as follows:
B A 1 2 3 4 5 6 1 x x x x x x 2 x x x x x x 3 x x x x x x Or in a horizontal form::
A
1
2
3
4
5
6
B
B
B
B
B
B
123
123
123
123
123
123
xxx
xxx
xxx
xxx
xxx
xxx
If Treatment A and Treatment B are also crossed with Treatment C (for example: 2 levels):
C
1
2
A
A
1
2
3
4
5
6
1
2
3
4
5
6
B
B
B
B
B
B
B
B
B
B
B
B
123
123
123
123
123
123
123
123
123
123
123
123
xxx
xxx
xxx
xxx
xxx
xxx
xxx
xxx
xxx
xxx
xxx
xxx
Treatment B is nested within Treatment A if different levels of Treatment B appear only once within a level of Treatment A, for example:
A
1
2
3
4
B
B
B
B
1
2
3
4
5
6
7
8
9
10
11
12
x
x
x
x
x
x
x
x
x
x
x
x
Treatment B, consisting of 12 levels, is nested within 4 levels of Treatment A. In this nested structure, it's possible for the design to be unbalanced, for instance at level 3 of Treatment A there are only 2 levels of Treatment B, while the others have 3 levels of Treatment B.
A
1
2
3
4
B
B
B
B
1
2
3
4
5
6
7
8
9
10
11
x
x
x
x
x
x
x
x
x
x
x
Nested patterns do not have interactions!
- Experimental/Environmental Design: Environmental conditions and the natural variability of objects that can obscure or disrupt the examination of the responses that emerge. This design relates to how treatments are placed on experimental units (e.g., Completely Randomized Design (CRD), Randomized Block Design (RBD), Latin Square Design (LSD), Lattice).
- Response Design: The response given by the experimental object. This relates to determining the characteristics of experimental units that will be used to assess or measure the influence of treatments.
Things to know in Response Design:
- Must reflect the influence being studied. Suppose you are conducting an experiment about the effect of cow manure fertilization on corn growth. Then you should create a response design that can reflect the influence of this manure on corn growth. For instance, plant height, leaf count, leaf area, etc.
- There are measurement scales:
- Qualitative: nominal and ordinal (cannot be analyzed by variance). This scale is subjective and the guidelines for conducting measurements are mostly non-standard.
- Quantitative: interval/range and ratio. This scale is objective and its measurement tools are often available.
- There are observation units, which are the smallest units used in measurement.
- There are evaluation units, which are the smallest units representing experimental units used in data analysis, or evaluation units are the average of observation units.


The type of treatment can be divided based on its nature and quantity. Based on its nature, treatment can be qualitative (e.g., type of fertilizer, variety, method of soil treatment) or quantitative (e.g., fertilizer dosage, volume of pesticide). Based on its quantity, treatment can be a single factor (only one factor being studied) or factorial (consisting of two or more treatments).
In response design, there are things to know such as the selection of characteristics that will assess or measure the influence of treatments, the presence of a measurement scale (qualitative or quantitative), the presence of an observation unit as the smallest unit in measurement, and the presence of an evaluation unit as the smallest unit representing experimental units in data analysis.
By understanding these three components: treatment design, environmental design, and response design, researchers can design and conduct experiments more efficiently and effectively, and minimize potential biases or disturbances that may arise.
Basic Principles in Experimental Design
A good experimental design should be effective, manageable, efficient, and capable of being monitored, controlled, and evaluated. Effectiveness relates to the ability to achieve the planned or outlined objectives, targets, and usefulness. Manageability relates to various limitations or constraints in conducting experiments or in analyzing data. Efficiency means rationalization in the use of resources, funds, and time to obtain information from the experiment.
Experimental design deals with techniques for overcoming and controlling variability or variables that disturb the actual influence of the treatment or factor under study, referred to as Environmental Design.
There are two types of sources of variability in experimental design:
- Main factors are the factors that will be studied and deliberately given.
- External factors: factors whose influence is expected to be as small as possible. These factors consist of:
- Factors that can be identified and their influence estimated before the experiment. For instance, in the case of wanting to know the difference between two corn varieties, if the two varieties give different results, the difference in these results, in addition to being caused by the difference in varieties, may also be caused by differences in soil fertility. To overcome this, grouping is usually performed, so that the variability among groups can be measured and removed from the experimental error.
- Factors that can be identified but whose influence cannot be anticipated. For example, in the case above, if the field has a gradual fertility direction from left to right so that the yield will decrease from left to right, if variety A is always planted to the right of variety B, then in this case variety B will be advantaged because relatively it is located on a more fertile land than variety A. So, in this case, the appearance of the yield of varieties A and B will be biased and favor B, and if we want to compare varieties A and B, the difference that occurs is not solely caused by the difference in varieties but also caused by differences in soil fertility. To overcome this, randomization is performed.
- Factors that cannot be identified. To overcome this, replication is performed.
To minimize experimental error to improve the accuracy of the experiment, it is necessary to have replication, randomization, and local environment control, which are the basic principles in experimental design. Orthogonality, confounding, and efficiency are additional principles. Other principles include orthogonality, confounding, and efficiency.
Local Environment Control
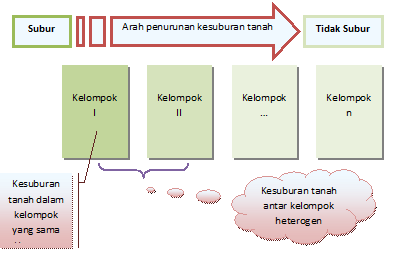
Local environment control means controlling environmental conditions that have the potential to affect the response to treatment. This can be done by:
- Experimental design. This is usually done by grouping the experimental units and each group contains all treatments so that the variability within the group is minimized and the variability between groups is maximized.

Figure 1.1 Example of grouping experimental plots
- Use of covariates. This is done if there is variability among experimental units. For example, if you want to know the difference in the effect of certain types of feed on the weight gain of chickens. Before being fed, the chickens already have different weights, so a covariate, the weight of the chicken before feeding, is used. Analysis using this variable in statistics is known as analysis of covariance.
- Increasing the size of the experimental unit. The smaller the experimental error (
 ), the greater the information obtained (or
  ). In other words, the larger the size of the experimental unit (n), the smaller the experimental error and the greater the information.
Randomization
Randomization is carried out by giving an equal chance to each experimental unit to be subjected to treatment. Randomization is also used to eliminate bias. For example, in an experiment with two corn varieties, the field has a fertility direction gradually from left to right so that the yield will decrease from left to right. To avoid this bias, the varieties are placed randomly on the experimental plots.

Figure 1.2 Example of systematic / non-random placement of plots
The non-random placement of the plots does not provide a valid estimate of the experimental error and will give biased results. In the example above, the field has a fertility direction gradually from left to right so that the yield will decrease from left to right. If variety A is always planted to the left of variety B, then in this case variety A will be advantaged because relatively treatment A is located on more fertile land than variety B. So in this case, the appearance of the yield of varieties A and B will be biased and favor A, and if we want to compare varieties A and B, the difference that occurs is not solely caused by the difference in varieties but also caused by differences in soil fertility. To avoid this, the plots must be placed in such a way that no variety is advantaged or disadvantaged. This can be done by placing the varieties randomly on the experimental plots.
Repetition
Repetition involves applying the same treatment to the experimental unit more than once. The function of repetition includes:
- Estimation of error. If an experiment does not contain repetitions, the experimental error cannot be estimated. We cannot explain precisely whether the differences that arise are due to differences among treatments or differences among experimental units.
- Increasing experimental precision. The use of less precise techniques or the use of less homogeneous experimental units can be overcome by increasing the number of repetitions. With an increase in repetitions, the population mean estimate will be more precise.
- Expanding the scope of conclusions. This is done through the selection of more varied experimental units, for example, repetitions done at different times.
- Controlling error variance. By making groups as repetitions, the experimental units within the group have minimum diversity, and the experimental units between groups have maximum diversity, making efforts to see treatment differences within the group more precise. This way, error variance can be controlled.
In determining the number of repetitions, several things that need to be considered include the variability of tools, materials, media, and the experimental environment, as well as the cost and labor available.
Each principle in experimental design plays an important role in ensuring the validity and reliability of the experiment's results. With these principles, we can ensure that our experimental results are accurate and trustworthy, and minimize the influence of factors we do not want.
Fixed and Random Models
The classification of factors into fixed or random models is essential in research, and it depends on the researcher's understanding of the field being studied. This classification helps researchers achieve uniform definitions and perceptions.
1. Fixed Model.
The fixed model refers to experiments where the treatment or level of the factor is determined by the researcher before the study begins. The researcher has a reason, usually based on knowledge in his field, to determine that these factors have certain characteristics that distinguish them from other factors. Each level can represent a population hypothesized or imagined by the researcher.
For example, in a study on the influence of Bali bull studs on the birth weight of offspring from uniformly bred females. If four studs are each mated with five uniform female cows, the stud factor could be a fixed or random model.
Bali bull studs are said to be a fixed model, if each stud can be identified as having certain characteristics determined by the researcher before the study. For example, the first stud is 2 years old, the second stud is 2.5 years old, the third stud is 3 years old, and the fourth stud is 3.5 years old. In this case, each stud can represent a set of populations hypothesized or imagined by the researcher.
Another example is when a researcher wants to study the effect of fertilizer variations (factor) on rice crop production. The researcher decides to use three different types of fertilizer: Fertilizer A, Fertilizer B, and Fertilizer C, which have been selected based on certain characteristics. In this context, the type of fertilizer is a fixed model, as the researcher has determined the types of fertilizer to be studied before the experiment begins.
2. Random Model.
Conversely, if a researcher conducts a study on the effect of plant varieties on harvest yields, but the plant varieties used are randomly selected from dozens or hundreds available, then this is an example of a random model. A researcher might randomly choose five varieties from a large population and plant them under identical conditions to see how they grow. In this case, the plant varieties represent a random model, as the researcher did not determine which varieties to use before starting the study.
In a fixed model, the researcher has defined their inference population. Let's say αi (i=1,2,3,...,t) represents the fixed effect of factor A at level I. As αi is considered constant, E(αi) = αi, the true mean of αi.
A factor is considered in the random model if a researcher randomly chooses t levels of a factor (t < T) from the factor's population. In this scenario, repeating to obtain t levels of factor A introduces an element of uncertainty. Let Ai (i=1, 2, 3,...,t) represent the random effect of factor A at level I, the true mean Ai=E(Ai)=0 for all i, as Ai is considered a random variable. Variability in the random model arises not only due to the variability of Ai values but also due to the variability of sample sizes based on the drawing with a choice.
3. Mixed Model.
The mixed model might occur if a researcher investigates the effect of fertilizer and plant varieties on harvest yields. Suppose the researcher has chosen three types of fertilizer (Fertilizer A, Fertilizer B, and Fertilizer C) and randomly selected five rice varieties from a large population. In this case, the fertilizer type represents a fixed model (because the researcher determined the types of fertilizer before the experiment began), while the plant varieties represent a random model (because the researcher randomly chose the varieties). This is an example of a mixed model, where some factors are chosen in a fixed manner, while others are chosen randomly.
The choice between fixed, random, or mixed models has significant consequences for the analytical approach used in the study. Here are some consequences:
- Fixed Model: In a fixed model, the researcher is typically interested in understanding the direct influence of specific levels or categories of the independent variable (factor) on the dependent variable. In this context, analysis of variance (ANOVA) is often used to evaluate the mean differences between groups. The primary goal is to determine if the observed differences between groups significantly differ from what might be expected based on random variation alone. Consequently, if the researcher wants to make inferences or generalizations to other factor levels beyond those chosen in the study, it might be inappropriate because the factor levels were specifically set by the researcher.
- Random Model: In a random model, the researcher is typically interested in variability between levels or categories of the independent variable. An appropriate analysis here might involve ANOVA, but with an understanding that conclusions are about variability in a broader population, not about the specific levels or categories chosen for the study. Consequently, results from a random model analysis can't be directly applied to specific levels or categories of the factor but rather to the entire population.
- Mixed Model: In a mixed model, there's a blend between an interest in specific level or category effects (from the fixed model) and an interest in variability (from the random model). Appropriate analysis might involve techniques like mixed analysis of variance or mixed linear models. Consequently, the study can become more complex and might require a deeper understanding of statistics and modeling.
In the context of experimental design, the choice of a fixed, random, or mixed model will significantly influence how data is analyzed and how the results are interpreted. Therefore, it's crucial for researchers to consider the research objectives, desired population, and the type of inference wanted before deciding on the appropriate model to use.
Calculations with Data Processing Application
SmartstatXL (Excel Add-In)
Analysis of Variance calculations for various Experimental Designs and further tests (LSD, Tukey's HSD, Scheffé's test, Duncan, SNK, Dunnet, REGWQ, Scott Knott) using SmartstatXL can be learned from the following link: SmartstatXL Add-In Documentation