Sidebar Menu
Main Menu EN
Descriptive Statistics
A collection of articles on Definition of Descriptive Statistics, Measures of Data Concentration, Measures of Spread, Examples of Skewness and Kurtosis Calculations, Frequency Distributions

- Details
- Written by Ade Setiawan
- Category: Descriptive Statistics
Statistics is a set of procedures for collecting, measuring, classifying, calculating, explaining, synthesizing, analyzing, and interpreting quantitative data obtained systematically. Broadly speaking, statistics are divided into two main components, namely descriptive statistics and inferential statistics . Descriptive statistics use numerical and graphical procedures to summarize data sets in a clear and understandable way, while inferential statistics provide procedures for drawing conclusions about the population based on the sample we observe. Descriptive statistics helps us to simplify large amounts of data in a logical way. Data that is much reduced and summarized so that it is simpler and easier to interpret.
- Hits: 741
- Details
- Written by Ade Setiawan
- Category: Descriptive Statistics
Means and measures of spread can describe the distribution of data but are not sufficient to describe the nature of the distribution. To be able to describe the characteristics of a data distribution, we use other concepts known as skewness and kurtosis.
- Hits: 922

- Details
- Written by Ade Setiawan
- Category: Descriptive Statistics
One of the most important aspects to describe the distribution of data is the value of the observation data center (Central Tendency). Any arithmetic measurement that is intended to describe a value that represents the central value or central value of a data set (set of observations) is known as a measure of data centering (central tendency). There are three commonly used data concentration measures, namely:
- Mean (Average arithmetic/arithmetic average)
- Median
- Mode
- Geometric Mean
- Harmonic Mean
In this article, we will discuss the meaning of several measures of data concentration accompanied by examples of calculations, both for single data or data that have been grouped in a frequency distribution table. In addition to the statistical measures above, several other statistical measures will be discussed, such as the Geometric Mean , Harmonic Average ( H) as well as some important characteristics that need to be understood for a good measure of central tendency and how to choose or use the exact value of central tendency.
- Hits: 1097
- Details
- Written by Ade Setiawan
- Category: Descriptive Statistics
Frequency distribution is a list of data values ( can be individual values or data values that have been grouped into certain intervals ) accompanied by the appropriate frequency value.
The measurement results we get are called raw data. The magnitude of the measurement results we obtain usually varies. If we look at the raw data, it is very difficult for us to draw meaningful conclusions. The raw data needs to be processed first so that we can get a good picture of the data.
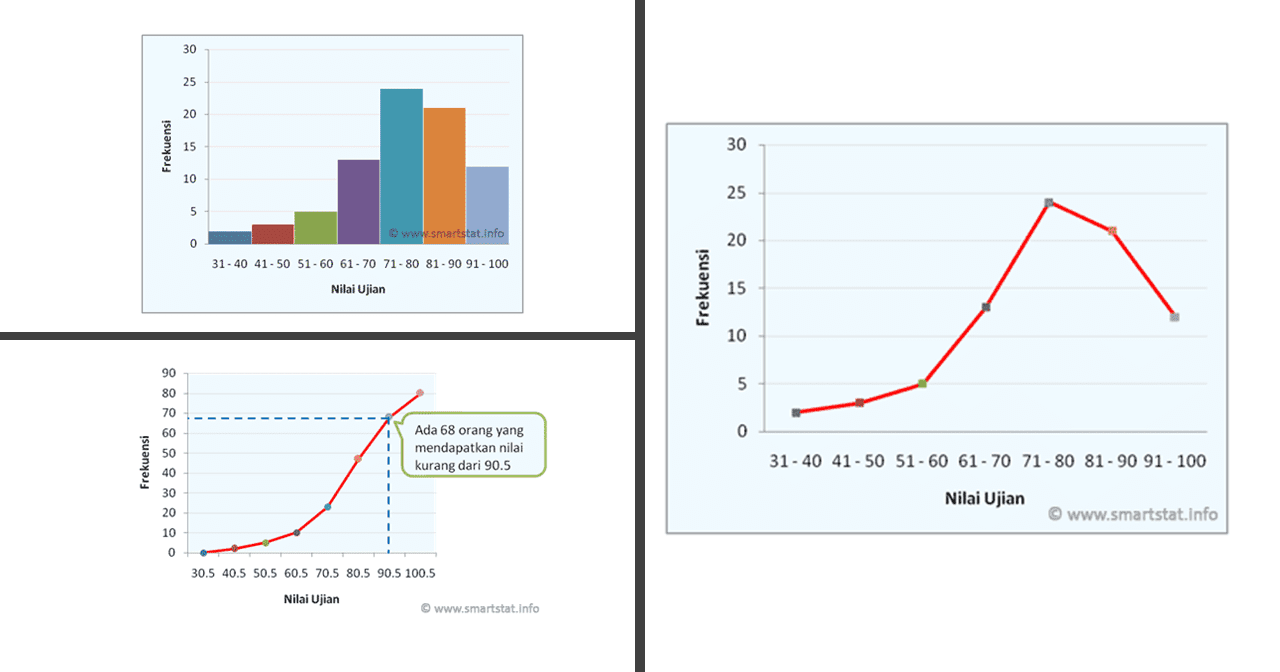
In this discussion, Smartstat will describe the meaning of frequency distribution accompanied by examples and Techniques for Making Frequency Distribution Tables . In addition, it will also discuss the Relative Frequency Distribution and Cumulative Frequency Distribution , Histogram , Frequency Polygon , and Ogive .
- Hits: 914

- Details
- Written by Ade Setiawan
- Category: Descriptive Statistics
The measure of dispersion (Measures of Dispersion) or a measure of the diversity of observations from their average value is called deviation/dispersion. There are several measures to determine the dispersion of observational data, such as range , quartile deviation , mean deviation , and standard deviation .
The measure of central tendency ( mean , median , mode ) is a representative value of a frequency distribution, but this measure does not provide a complete picture of information about how the distribution of observational data is to the central value. Measures of central tendency alone are not sufficient to describe the frequency distribution. In addition, we must have a measure of the distribution of observational data.
- Hits: 1025