Pearson Correlation Analysis is a statistical method used to measure the strength and direction of the relationship between two quantitative variables. The importance of this analysis in statistical research cannot be overstated, as it helps us understand the extent to which these variables influence each other. With SmartstatXL, performing Pearson Correlation Analysis becomes easier and more efficient.
The correlation output is displayed in the form of a correlation matrix that is equipped with significance markers. Significant correlation values are indicated by an asterisk (*) and are colored red. You have the option to display the output as either correlation values (r) or significance values (p-values).
In the paid version, starting from the Basic Edition, you can even choose whether to include a Scatter Plot in the output or not. Similar to Descriptive Analysis, the output can be grouped based on certain categories. Thus, SmartstatXL becomes an extremely useful tool for simplifying your data analysis process.
Steps for Correlation Analysis
- Activate the worksheet (Sheet) to be analyzed.
- Place the cursor on the dataset (for creating datasets, see Data Preparation guide).
- If the active cell (Active Cell) is not on the Dataset, SmartstatXL will automatically try to determine the Dataset.
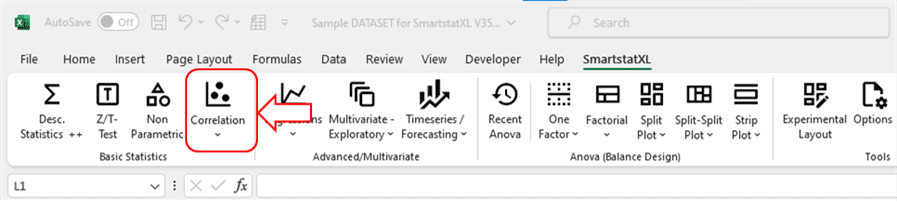
- Activate the SmartstatXL Tab
- Click on the Correlation menu.

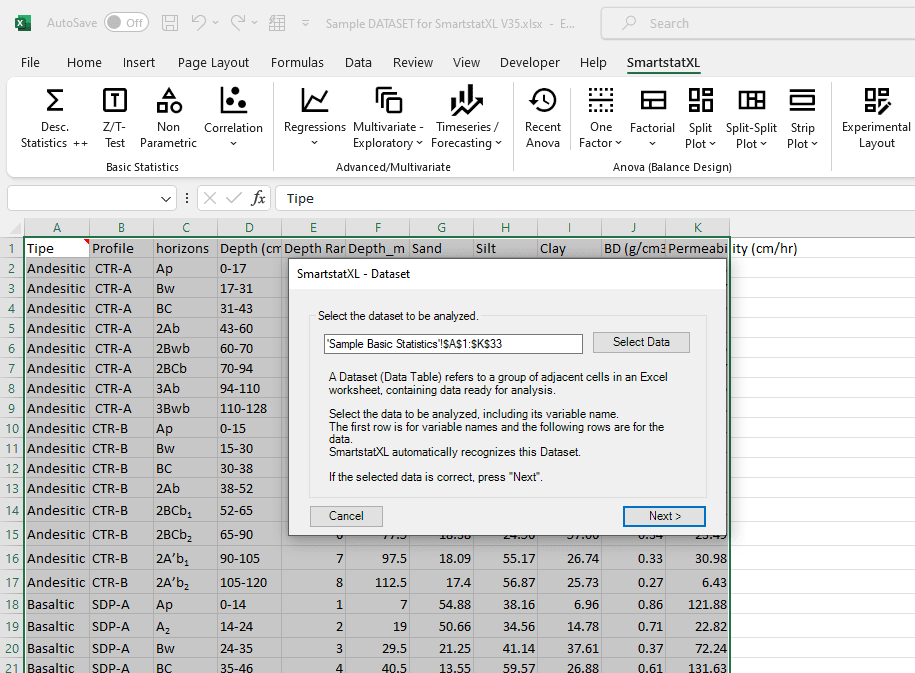
- SmartstatXL will display a dialog box to ensure the Dataset is correct (usually, the cell address of the Dataset is automatically selected correctly).

- If correct, Click on the Next Button
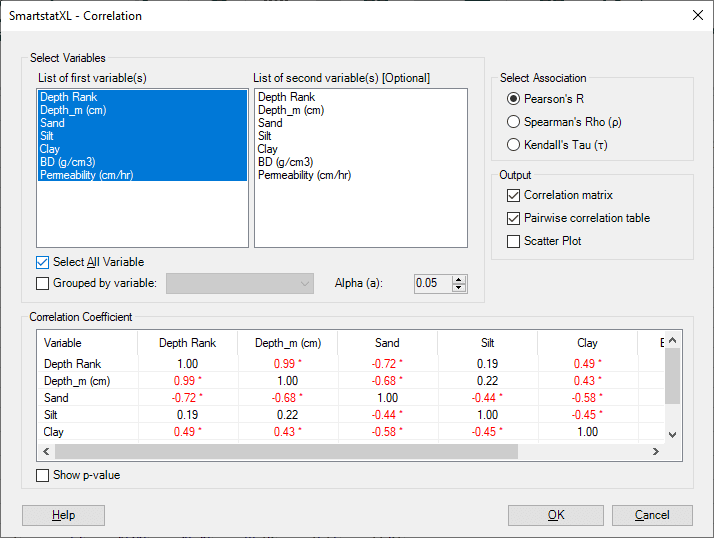
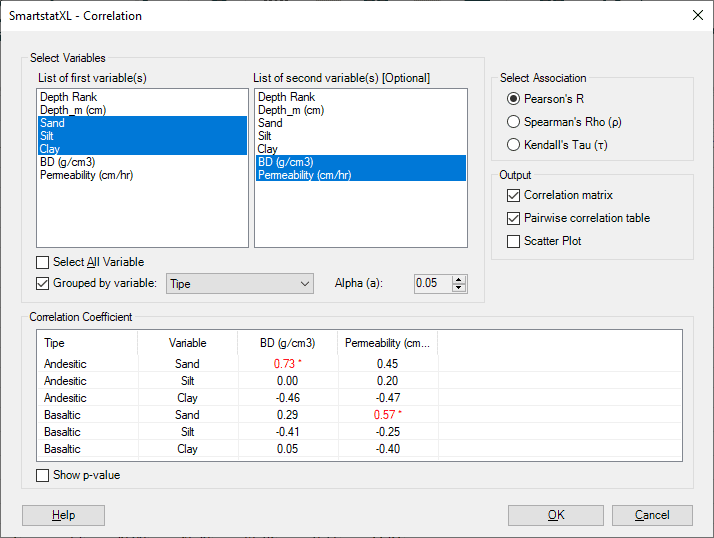
- Next, the Correlation Analysis Dialog Box will appear. Select the Variables to be analyzed.

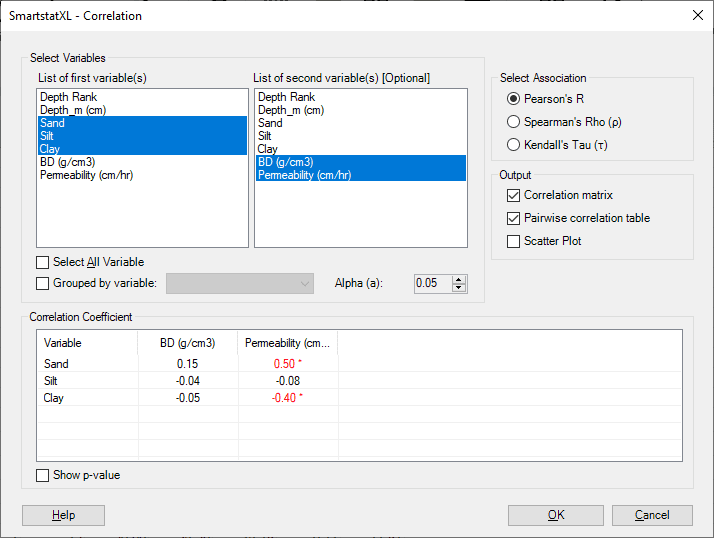
- If you wish to group statistical values based on certain categories, check the box "Group by" and select the Variable to be used as the Category/Group.
- If you wish to see the p-values, activate the checkbox "Show p-values" by ticking it.
- Check the box "Scatter Plot" to include a Scatter Plot chart in the output.
- Next, press the "OK" button.
Correlation Analysis Results
Pearson Correlation Matrix and Pairwise Correlation Table
Without categorization based on specific Variables
Below is the interpretation of the correlation analysis results:
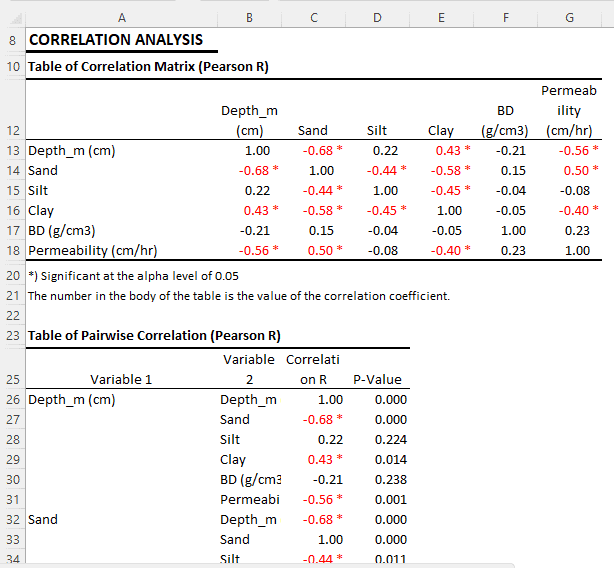
Pearson correlation analysis is used to measure the strength and direction of the relationship between two variables. In this correlation matrix table, we can see the relationship between various variables such as depth (Depth_m), soil composition (Sand, Silt, Clay), bulk density (BD), and permeability.
- Depth (Depth_m) has a significant negative correlation with Sand (-0.68) and Permeability (-0.56), indicating that as depth increases, the composition of sand and permeability tends to decrease. Meanwhile, depth has a significant positive correlation with Clay (0.43), indicating that as depth increases, the composition of clay tends to increase.
- Sand has a significant negative correlation with Silt (-0.44), Clay (-0.58), and Depth_m (-0.68), but has a significant positive correlation with Permeability (0.50). This suggests that as the sand composition increases, the composition of silt, clay, and depth tends to decrease, while permeability tends to increase.
In this context, it is important to note that correlation does not imply causation. Even though there is a relationship between these variables, we cannot conclude that changes in one variable cause changes in another variable based solely on this correlation analysis.
Categorized Based on Specific Variables
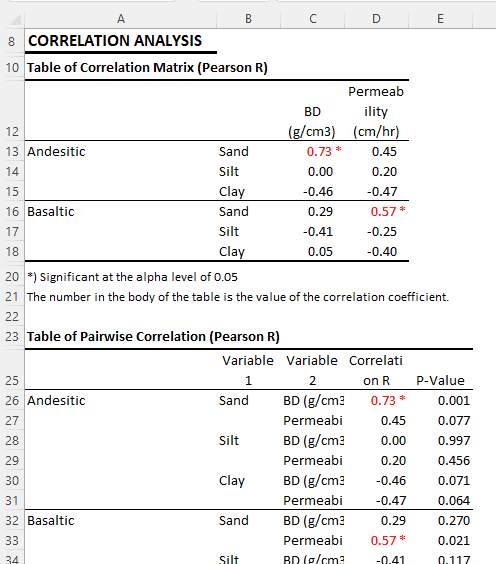
This table displays the correlation matrix between soil composition (Sand, Silt, Clay), bulk density (BD), and permeability for two types of parent material, namely Andesitic and Basaltic.
For Andesitic Parent Material:
- Sand exhibits a significant positive correlation with BD (0.73), meaning that as the sand composition increases, the bulk density tends to rise. Meanwhile, Sand has a positive but non-significant correlation with Permeability (0.45).
- Silt shows no significant correlation with either BD or Permeability.
- Clay has a negative but non-significant correlation with BD (-0.46) and Permeability (-0.47), implying that as the clay composition increases, both bulk density and permeability tend to decrease.
For Basaltic Parent Material:
- Sand has a positive correlation with BD (0.29) and Permeability (0.57), but only the correlation with Permeability is significant. This means that as the sand composition increases, permeability tends to increase.
- Silt has a negative but non-significant correlation with BD (-0.41) and Permeability (-0.25).
- Clay exhibits a non-significant positive correlation with BD (0.05) and a non-significant negative correlation with Permeability (-0.40).
In this context, it is crucial to note that correlation does not indicate causation. Even though there is a relationship between these variables, we cannot conclude that changes in one variable cause changes in another based solely on this correlation analysis.
ScatterPlot
In the following analysis, we will explore the relationship between soil composition (Sand, Silt, Clay), bulk density (BD), and permeability using scatter plots. Scatter plots are effective tools for showing the correlation between two variables. Each point on the plot represents an individual observation. Additionally, a trendline can be added to provide a general overview of the direction and strength of the relationship between the variables.
Each scatter plot also comes with a correlation value, providing a numerical measure of the strength and direction of the relationship between the two variables. By understanding these correlation values, we can better comprehend the relationship between these variables.
Uncategorized Based on Specific Variables
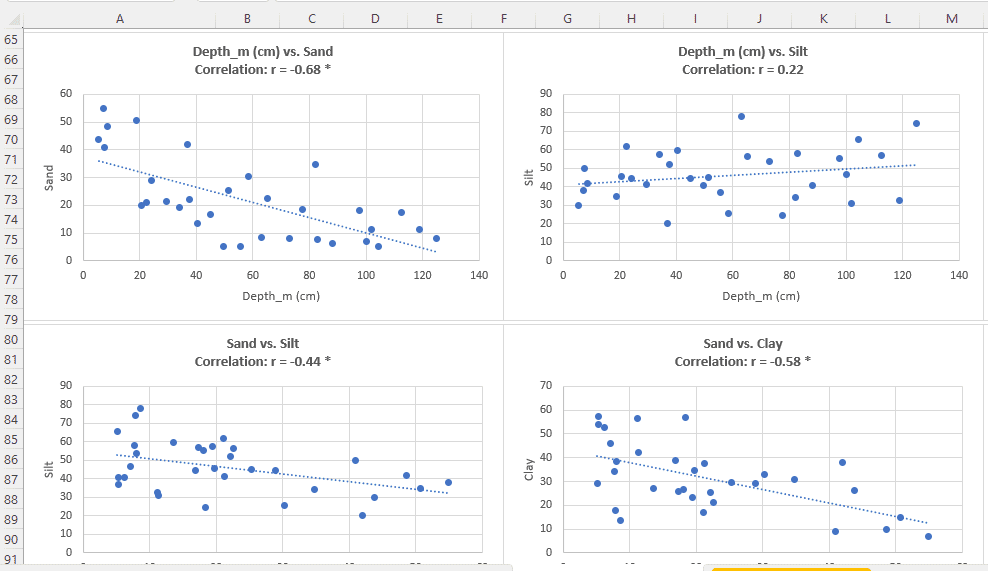
The scatter plot is not grouped based on any specific variable categories. This will give us a general overview of the relationship between the variables.
Categorized Based on Specific Variables:
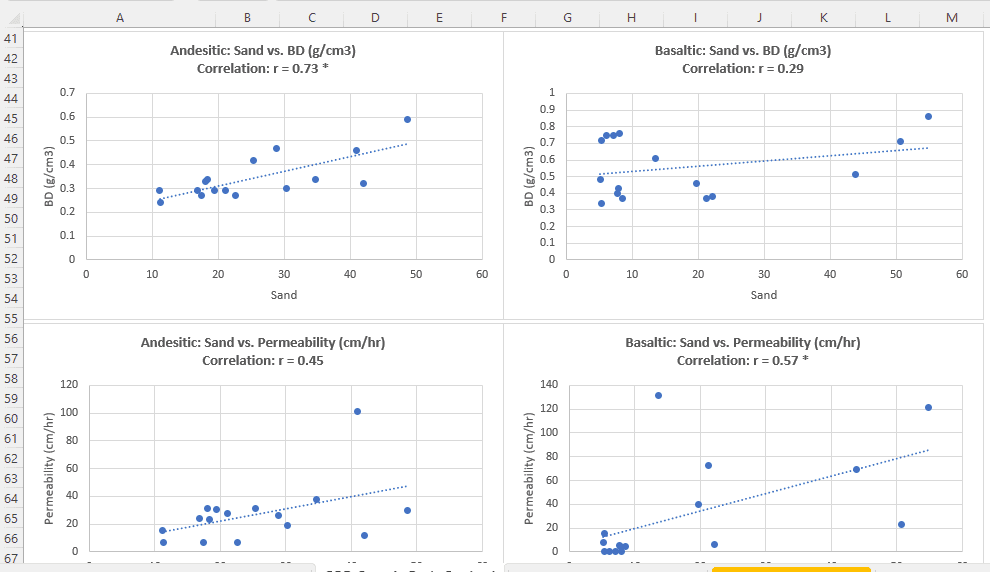
The scatter plot is grouped based on the type of parent material. This allows us to see how the relationship between the variables changes based on the type of parent material.
By comparing these two plots, we can understand how the type of parent material affects the relationship between soil composition, bulk density, and permeability.