Sidebar Menu
Main Menu EN
Multivariate Analysis
Welcome to our comprehensive guide on Multivariate Analysis with SmartstatXL. In this guide, you will find a variety of tutorials designed to help you understand and implement various types of multivariate analyses using the Excel add-in, SmartstatXL. Each tutorial is designed to provide a clear and easily understandable explanation of how to conduct each type of analysis, so you can confidently apply them in your own research.
Starting from Discriminant Analysis, which helps you understand the differences between two or more groups based on measured variables, to various types of cluster analyses such as K-Means and Agglomerative Hierarchical Clustering (AHC). You will also find guides on how to conduct Factor Analysis, Principal Component Analysis (PCA), and Reliability Analysis. Each of these tutorials is designed to provide you with an in-depth understanding of each method and how to apply them using SmartstatXL.
- Details
- Written by Ade Setiawan
- Category: Multivariate Analysis
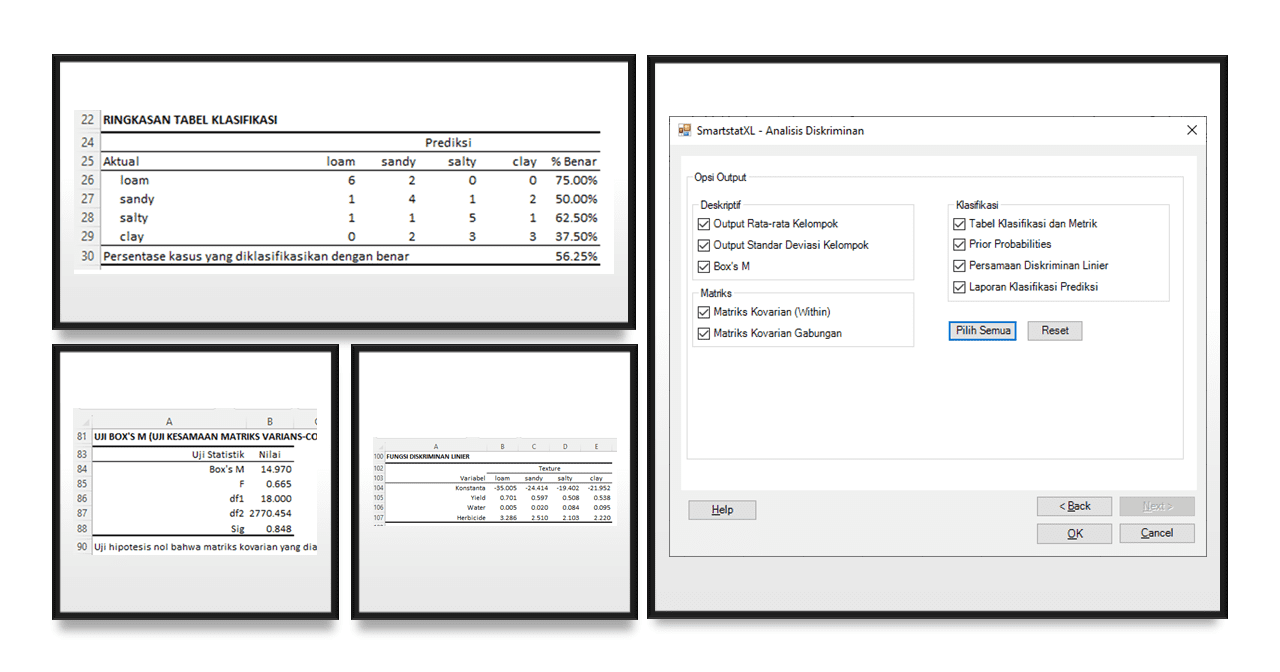
Discriminant analysis is a statistical technique used to distinguish or predict groups based on the differences among those groups. This technique is very useful in various fields, such as psychology, medical, market, agricultural research, and others, where we need to understand classification or groups.
Discriminant analysis works by developing one or more discriminant functions that help distinguish between different groups based on a combination of selected variables. The discriminant function can be considered as a line or surface that separates groups. The value of the discriminant function can be used to predict which group a particular case belongs to.
- Hits: 480
- Details
- Written by Ade Setiawan
- Category: Multivariate Analysis
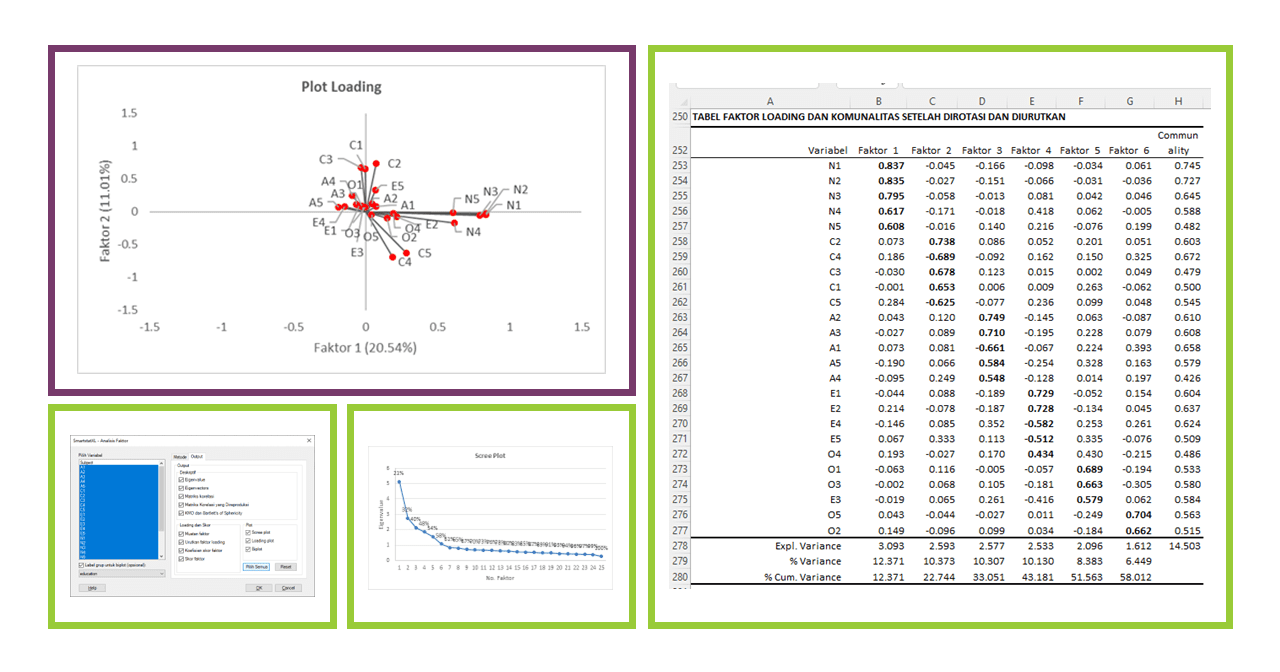
Factor Analysis is a multivariate statistical technique used to identify latent variables or factors underlying a set of observed variables. Its primary purpose is to reduce the dimensionality of data and find structure in the relations among the variables. In other words, it helps us understand the structure of variables and transfers information from a large number of variables into a smaller number of factors or components.
- Hits: 516
- Details
- Written by Ade Setiawan
- Category: Multivariate Analysis
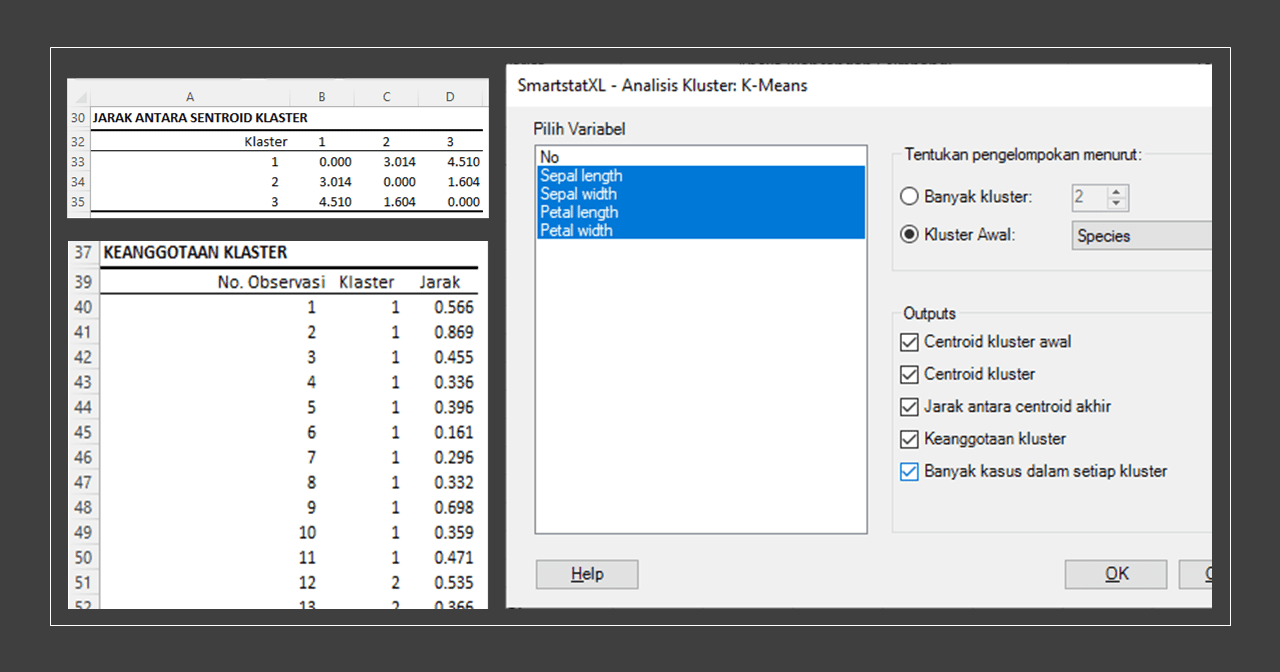
Cluster analysis is a statistical technique used to group objects or cases into several groups based on the information found in the data describing the objects and their relationships. The main purpose of cluster analysis is to identify structure or segments in the data.
One of the most popular and simple methods in cluster analysis is the K‑Means algorithm. This algorithm is named "K-Means" because the data grouping process is done by calculating the average (mean) of each cluster. The 'K' value in K-Means refers to the number of clusters that will be created from the data.
- Hits: 545

- Details
- Written by Ade Setiawan
- Category: Multivariate Analysis
Principal Component Analysis (PCA) is a technique in statistics that is used to combine multiple possibly correlated variables into a smaller set of variables called principal components. This technique is often used in dimensionality reduction, that is, trying to reduce the number of variables used in analysis.
- Hits: 635

- Details
- Written by Ade Setiawan
- Category: Multivariate Analysis
Cluster analysis is a statistical technique used to group similar objects into one or more groups or clusters based on the features these objects possess. This method is often used in various fields, such as computer science, marketing, biology, and others.
Agglomerative Hierarchical Clustering (AHC) is a type of hierarchical clustering method commonly used in cluster analysis. The term "agglomerative" refers to the way this method works, starting with each data point as a separate cluster, and then combining (agglomerate) these clusters based on the level of similarity between clusters until there is only one large cluster left.
- Hits: 757
- Details
- Written by Ade Setiawan
- Category: Multivariate Analysis
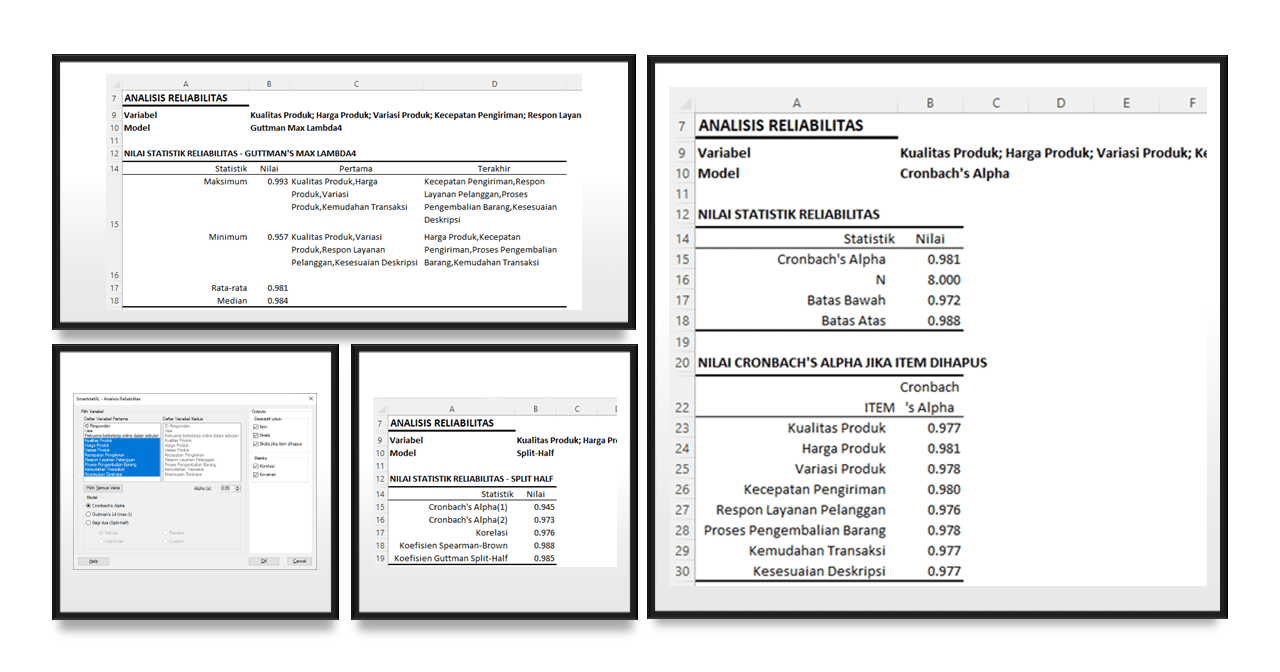
Reliability analysis is the process of evaluating the extent to which an instrument, such as a survey or test, produces consistent and stable results over time. It is an important concept in quantitative research and psychometrics.
There are several types of reliability, including:
- Hits: 728