Sidebar Menu
Main Menu EN
SPSS
Welcome to the SPSS Tutorial info page

SPSS is one of the most popular data processing programs. You can use SPSS to view, edit or perform calculations, manage data, sort and filter data, create graphs, analyze data, print and so on.
There are several SPSS tutorials that you can learn yourself on the smartstat site.
Most of the SPSS tutorials are presented in interactive flash format (made with adobe captivate), designed especially for beginners and packaged in a concise and very easy to understand way. In addition, the tutorial is also equipped with tips, tricks, and interpretations so that it will help you understand and master the SPSS Program easily and quickly.
The following is a series of Data Analysis Tutorials using SPSS .
You can download the sample SPSS Tutorial data at the following link:
- Details
- Written by Ade Setiawan
- Category: SPSS
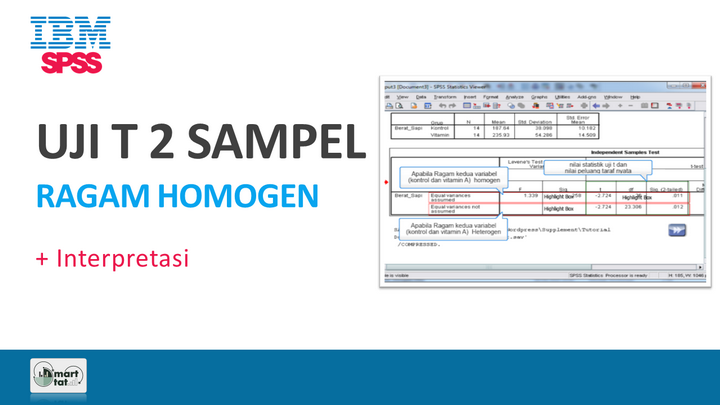
Test the hypothesis for the difference in the mean of two random samples with the same variance ( t-Test: Two-Sample Assuming Equal Variances )
The following is a two-way student t-test tutorial to compare two median values of a random sample (population) with the same variance ( t-Test: Two-Sample Assuming Equal Variances ) using SPSS Software . This t-test assumes that the two data groups come from a distribution with the same variance.
- Hits: 812
- Details
- Written by Ade Setiawan
- Category: SPSS
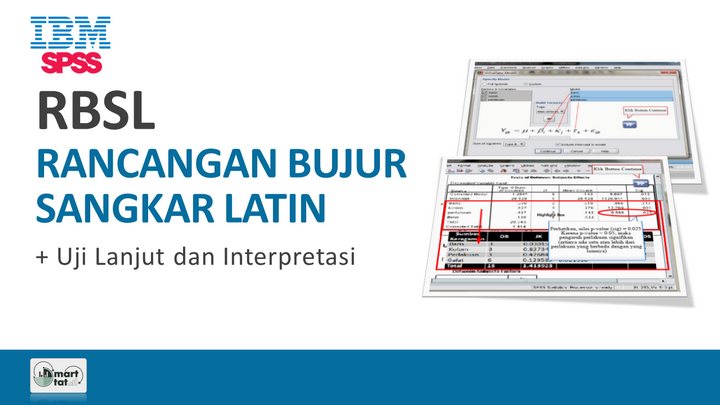
This tutorial will guide you how to perform a Latin Square Design Variety Analysis ( RBSL ) using SPSS .
This tutorial includes:
- Example of RBSL Data and Data Format in SPSS
- Linear Modeling
- Advanced Test (Post Hoc)
- Output Interpretation
- Hits: 1046

- Details
- Written by Ade Setiawan
- Category: SPSS
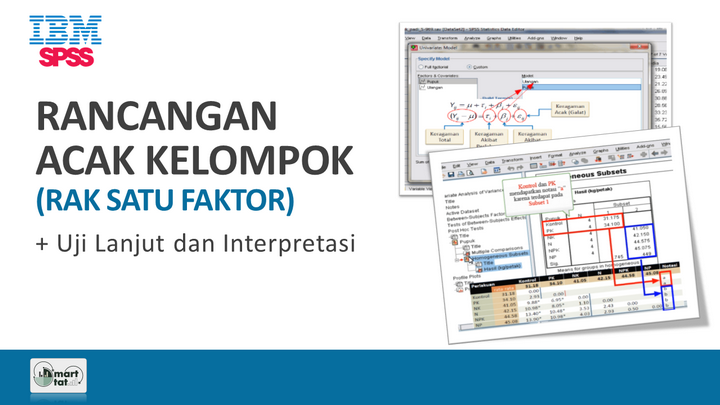
SPSS Tutorial for Analysis of Variance of Single Factor RAL .
This T UTORIAL will guide you how to perform a Completely Randomized Design Variance Analysis (CRD) using SPSS 17 Software .
Before studying this tutorial, it is recommended that you study and understand the Single Factor Completely Randomized Design material first. The data used in the tutorial is the same as the sample data used in the Manual Calculation of the Example of a Single Factor CR Variance Analysis . You can learn the manual calculation at the link above or on Slide: Completely Randomized Design .
- Hits: 1159

- Details
- Written by Ade Setiawan
- Category: SPSS
SPSS Tutorial for CRD Factorial Variance Analysis .
Before studying this tutorial, you should first study and understand the Factorial RAL Experiment Material . The data used in the tutorial is the same as the sample data used in the Example Calculation of Factorial RAL Variance Analysis manually. Manual calculations can be learned at the link above or on the Factorial Experiment Slide . In addition, it is recommended that you study the SPSS Tutorial for Basic Design first ( RAL , RAK , and RBSL Tutorials ), because the steps for analyzing and interpreting SPSS output are explained in detail in the Tutorial.
- Hits: 1054
- Details
- Written by Ade Setiawan
- Category: SPSS
This tutorial will guide you on how to perform a Randomized Block Design Variation Analysis ( RAK) using SPSS .
This tutorial includes:
- Example of RAK Data and Data Format in SPSS
- Linear Modeling
- Advanced Test (Post Hoc)
- Output Interpretation
- Hits: 1418

- Details
- Written by Ade Setiawan
- Category: SPSS
SPSS Tutorial for RCBD Factorial Variation Analysis .
Before studying this tutorial, you should first study and understand the RCBD Factorial material . The data used in the tutorial is the same as the sample data used in the Example Calculation of the Analysis of Variance for RCBD Factorial manually. You can learn the manual calculation at the link above or on the Factorial Experiment Slide . In addition, it is recommended that you study the SPSS Tutorial for Basic Design first ( RAL , RAK , and LSD Tutorials ), because the steps for analyzing and interpreting SPSS output are explained in detail in the Tutorial.
- Hits: 1223
More Articles ...
Page 1 of 2